

ClearPath Benchmarking
Benchmarking is the secret sauce for understanding your survey results. Learn how you compare to others in your industry and gain an edge on your competition.
Benchmark against your competition
Benchmarking is the process of comparing your organization against a peer group, allowing interpretation of your scores relative to others. Because benchmarking data standardizes performance, it’s the only way to understand the meaning of your survey scores.

Operate at peak performance
Benchmarking ensures you’re making the smartest business decisions, delivering optimum customer and employee experiences, and maximizing sales.
Benchmarking provides you with:
- Objective data. Without benchmarking, scaled survey data is subject to interpretation.
- Comparative data. Since benchmarking data is standardized and objective, comparing across groups, divisions, units, and categories is instantly simplified.
- Enduring data. Industry standards will change over time, and benchmarking data has the flexibility to adapt to changes.

See how your survey scores hold up against your competition
Benchmarking gives you an edge by objectively illuminating your strengths and weaknesses.
Your NBRI benchmarking database will be:
- Similar to your organization. Comparing yourself against others in your industry is critical to an accurate understanding of performance.
- Robust. A good benchmarking database contains data points from multiple organizations. By ensuring adequate coverage, you guarantee an accurate description of your performance.
- Focused at the question level. Benchmarking data is tabulated at the question level, allowing performance assessments across specific items and an understanding of total organizational performance.
NBRI houses the largest and highest quality employee, customer, guest, patient, and physician benchmarking databases in the world.
Get a free quoteKnow exactly where you stand with NBRI benchmarking
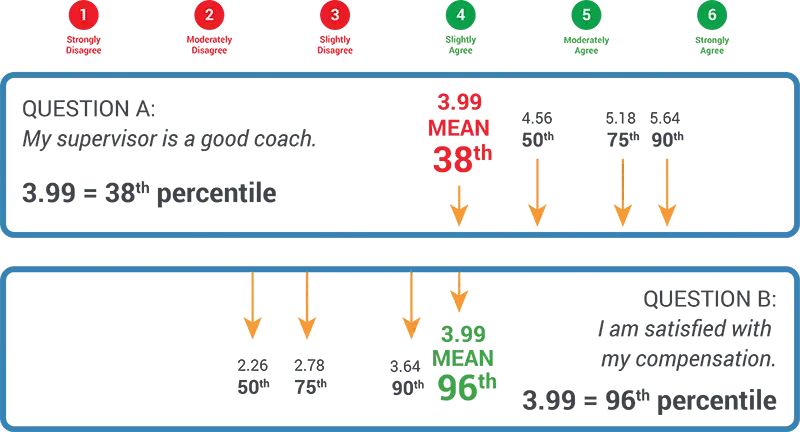
The graphic below shows a specific example of benchmarking in the organizational context. The mean scores of the responses to “My supervisor is a good coach” and “I am satisfied with my compensation” are identical at 3.99. However, when benchmarked against scores from other people, it’s clear that the first has a low score at the 38th percentile and the second has a high score at the 96th percentile.
What our customers are saying about NBRI
“The information NBRI provides is incredibly insightful and helpful with ensuring we are doing everything possible to keep our employees happy and balanced.”
Other Full-Service Solutions
Research
Proper research, done right—the first time. Get pure, clean data from our scientific, psychological research.
Learn MoreAnalytics
Do you know the story your data tells? We provide actionable, AI-assisted, trends and metrics you won’t get anywhere else.
Learn MoreIntegration
We increase the effectiveness of all your survey research projects with a common framework that results in dramatic organizational improvement.
Learn MoreAction
NBRI’s best practices for acting upon feedback. Move from data collection to action in three weeks.
Learn MoreFinancial
Improve your financial performance in the shortest time possible. Achieve an ROI many times the cost of your study.
Learn MoreMake our team your team
We handle it all, from survey creation and in-depth reporting to turning the research into real benefits for you. Tell us what you need, and we’ll deliver.
Still not sure?
NBRI surveys give businesses a competitive edge, forming a clear path to profit improvement. Reach out today for more information — we are here to help.
Trusted by thousands of businesses since 1982


 By submitting this form you agree to our