

Infographic: The True Cost of Customer Satisfaction (and Dissatisfaction)
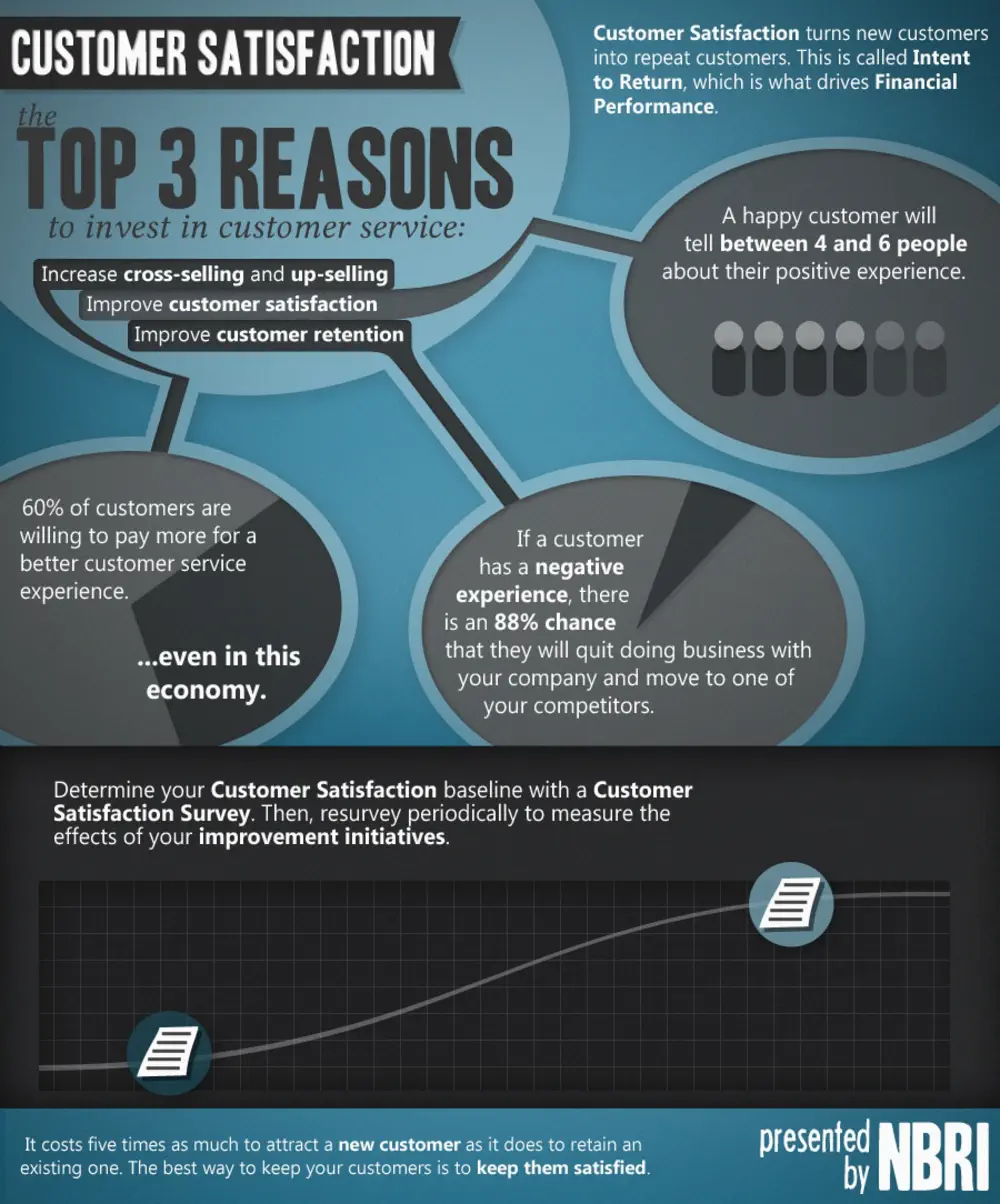
Customer satisfaction isn’t just a metric—it’s a leading indicator of financial performance. This infographic visualizes the critical relationship between customer satisfaction, retention, and revenue.
Key Statistics Highlighted:
- It costs five times as much to attract a new customer as it does to retain an existing one
- A 5% increase in customer retention can increase profits by 25-95%
- Satisfied customers tell 9 people about their experience; dissatisfied customers tell 22
These statistics underscore why leading organizations invest in systematic customer satisfaction measurement. NBRI’s customer satisfaction surveys provide the scientific foundation for understanding what drives customer loyalty, enabling targeted improvements that protect and grow revenue.
Our ClearPath Analytics platform transforms satisfaction data into actionable insights. Rather than generic metrics, you receive root cause analysis showing exactly which factors influence satisfaction for your specific customer segments.
Download this infographic to share these compelling statistics with your leadership team, or contact NBRI to discuss how our customer satisfaction survey methodology can help your organization retain more customers and grow profitably.

























 By submitting this form you agree to our